
Managing a homelab often starts with a single Docker container and quickly escalates into dozens of self-hosted services. As the footprint grows, keeping tabs on CPU spikes, memory leaks, disk wear, and container logs becomes essential.
The traditional solution, which usually involves spinning up a heavy monitoring stack like Prometheus, Grafana, Node Exporter, and Loki, often consumes more resources than the homelab services themselves. For a modest server or a collection of low-power nodes, you need something that is fast, lightweight, and simple to configure.
Beszel and Dozzle make a great alternative.
Beszel provides real-time system metrics and container resource usage across multiple nodes. Dozzle complements it by offering a web-based, real-time log viewer for all running containers. Together, they form a monitoring setup that runs on less than 50MB of RAM.
In this guide, we will walk through setting up a clean deployment of both tools on your server, and then show you how to run Beszel on an old Android phone to monitor its resource usage as an auxiliary homelab node.
Beszel vs Dozzle: What’s the Difference?
While both tools monitor Docker environments, they solve two completely distinct operational needs:
| Feature / Capability | Beszel (Metrics & Alerts) | Dozzle (Log Streaming) |
|---|---|---|
| Primary Purpose | System & Container Resource Metrics | Real-time Container Log Viewer |
| What It Tracks | CPU, RAM, Disk I/O, Network, GPU, S.M.A.R.T, Docker Stats | stdout & stderr Docker Container Logs |
| Architecture | Central Hub + Lightweight Agents across nodes | Single container connected to /var/run/docker.sock |
| Historical Data | Yes (Stores long-term trend graphs) | No (Pure live stream, no database overhead) |
| Alerting | Discord, Telegram, Pushover, Webhooks | None (focuses solely on log viewing) |
| Memory Footprint | ~15MB – 25MB RAM | ~10MB – 20MB RAM |
Summary: Use Beszel to find out which service is hogging memory or when your server is down. Use Dozzle to inspect why a container crashed by reading its live log output.
Why Beszel and Dozzle?
- Beszel is an open-source, lightweight resource monitor. It uses a hub-and-agent architecture. You host one central Hub (which displays the dashboard) and install a tiny Agent on each machine you want to monitor. It tracks CPU, memory, disk, network, GPU usage, temperatures, and per-container resource metrics.
- Dozzle is a dedicated log viewer. It streams Docker container logs directly to your browser. It does not store logs or index them; it simply connects to the Docker socket to provide instant visibility when debugging.
Why Beszel is a self-hosting must-have
When self-hosting, your hardware resources are usually at a premium. Unlike enterprise setups with dedicated operations budgets, a home server might be an old optiplex, a Raspberry Pi, or a repurposed laptop. You need deep visibility, but you cannot afford to waste 1-2GB of RAM on Prometheus and Grafana.
Beszel solves this problem by packing three critical monitoring components into an incredibly lightweight footprint. The main home dashboard lists all your systems side-by-side:
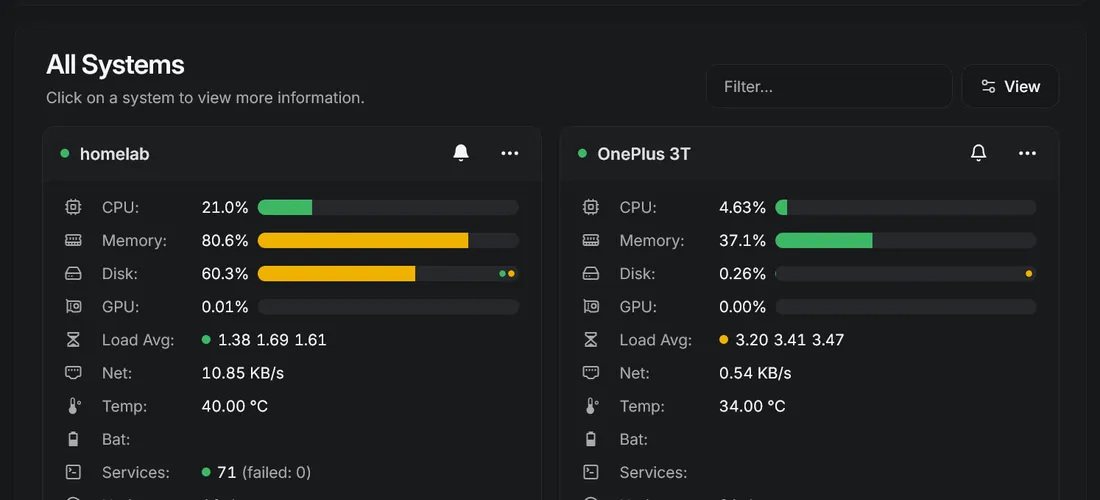
Beszel splits metrics into three specific categories:
1. System metrics
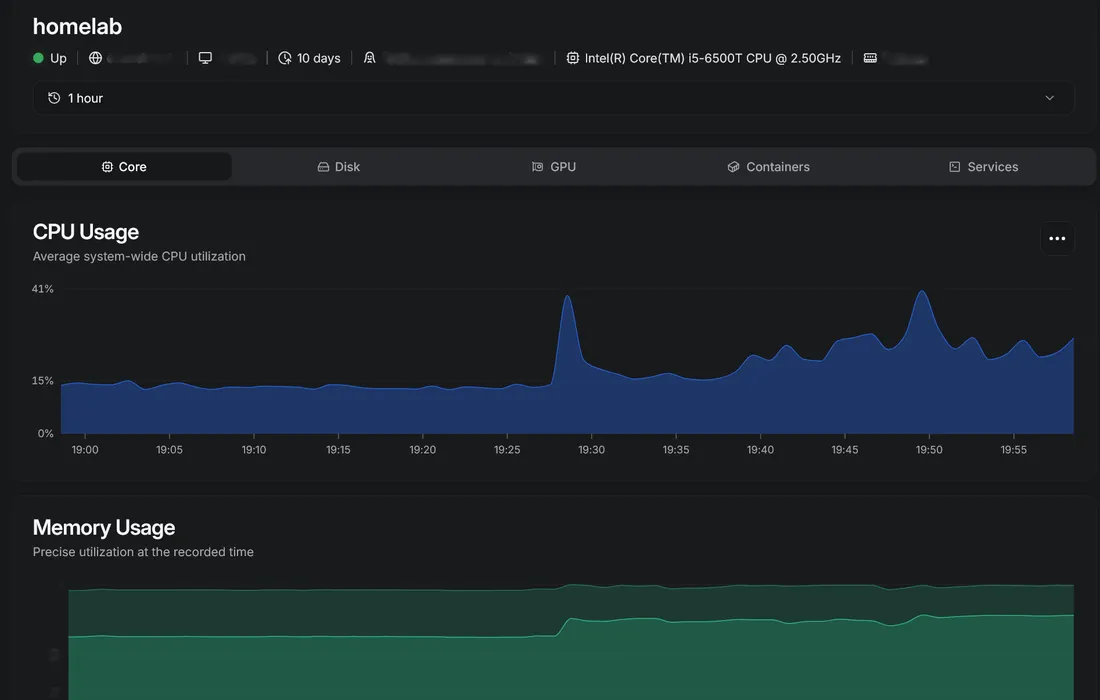
Beszel tracks long-term system resource trends, including CPU, RAM, network bandwidth, and disk space usage. This lets you view historical spikes and spot pattern changes over days, weeks, or months.
2. Container metrics
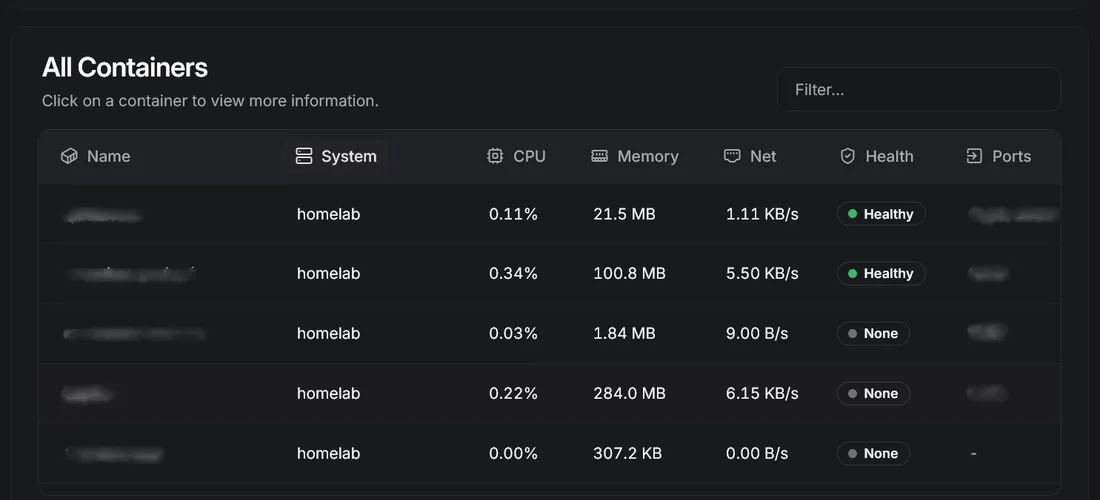
Instead of running docker stats in a terminal to see which service is slowing down your system, Beszel auto-detects running containers and charts their individual resource footprint. If a container starts eating memory or pinning the CPU, you will see it immediately.
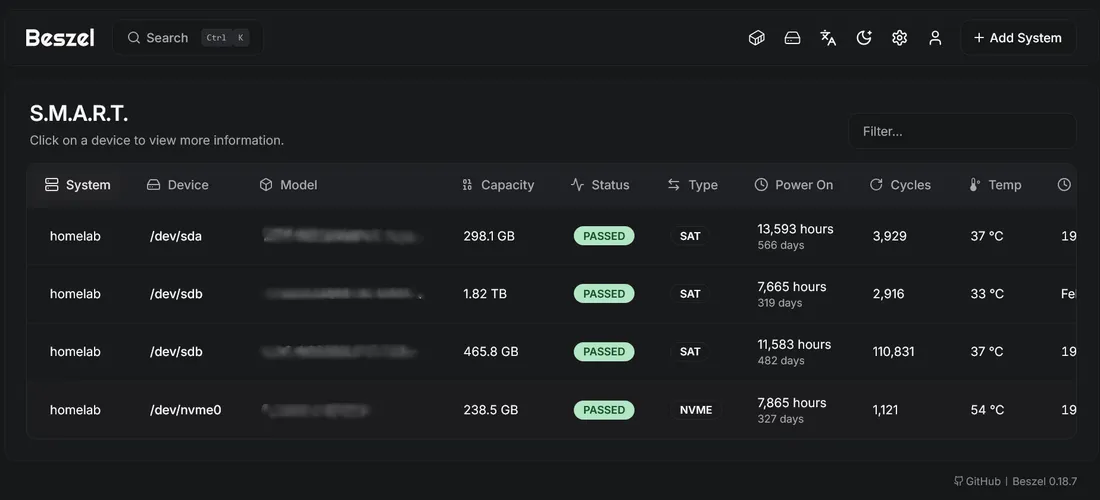
3. S.M.A.R.T metrics
Hard drive failures are one of the most common causes of data loss in a homelab. Beszel queries S.M.A.R.T database statistics to track temperature, write stats, bad sectors, and overall disk health. It can alert you before a drive completely dies.
4. Real-time alerts
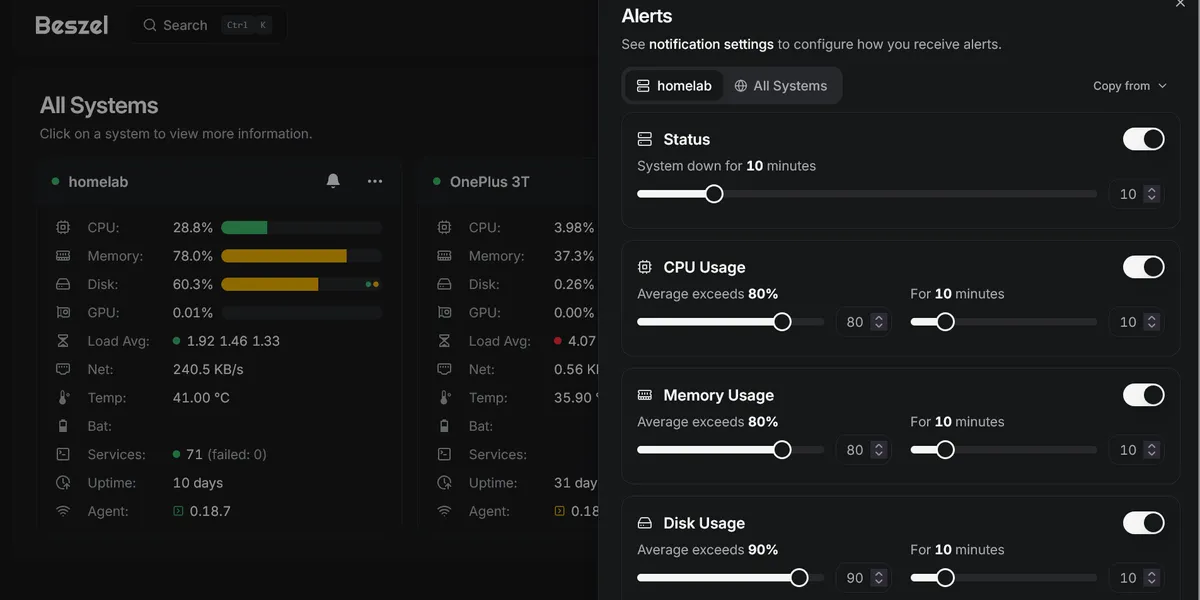
A monitoring tool is only as good as its notification engine. Beszel lets you configure threshold triggers for critical system metrics. You can set up rules to alert you if a system goes offline, CPU temperature rises too high, memory exceeds a safe range, or disk space runs low. It natively integrates with Discord, Telegram, Pushover, Gotify, and generic webhooks.
1. Setting up Beszel
Because Beszel splits visual presentation from metric gathering, we host the central dashboard (the Hub) and the collector (the Agent) on our primary server.
Generic Docker Compose configuration
Create a file named beszel-compose.yml. This configuration defines both the central hub and the agent that monitors the host server.
services:
  beszel:
    image: henrygd/beszel:latest
    container_name: beszel
    restart: unless-stopped
    ports:
      - 9002:8090
    volumes:
      - ./beszel_data:/beszel_data
    environment:
      PUID: 1000
      PGID: 1000
      TZ: UTC
      # Security: restricts embedding in frames
      CSP: "frame-ancestors 'self';"

  beszel-agent:
    image: henrygd/beszel-agent:latest
    container_name: beszel-agent
    restart: unless-stopped
    network_mode: host
    cap_add:
      - CAP_PERFMON
      - SYS_RAWIO
      - SYS_ADMIN
    # Expose host hardware and storage info
    devices:
      - "/dev/dri/card0:/dev/dri/card0" # your graphics card
      - "/dev/sda:/dev/sda" # your storage device
      - "/dev/nvme0:/dev/nvme0" # your storage device
    volumes:
      - /var/run/docker.sock:/var/run/docker.sock:ro
      - /var/run/dbus/system_bus_socket:/var/run/dbus/system_bus_socket:ro
      # Add optional path to monitor host storage mounts if needed
      # - /mnt/storage:/extra-filesystems/storage:ro
    environment:
      PORT: 4567
      KEY: "YOUR_AGENT_PUBLIC_KEY_FROM_HUB"
Explaining the configuration parameters
network_mode: host: The agent runs directly on the host network stack to reliably fetch system metrics and network statistics.cap_add(Capabilities): Providing capabilities likeSYS_RAWIOandCAP_PERFMONallows the agent to read hardware temperatures and drive health (SMART data) safely.KEY: This is the public key generated by the Beszel Hub. When you first launch the Hub dashboard (athttp://<your-server-ip>:9002), create an account, click “Add System”, and copy the generated public key into your agent environment file ordocker-composedefinition.
2. Setting up Dozzle
Dozzle runs as a single lightweight container. It only needs access to the read-only Docker socket to read logs from other containers running on the same host.
Generic Docker Compose configuration
Create a file named dozzle-compose.yml:
services:
  dozzle:
    container_name: dozzle
    image: amir20/dozzle:latest
    restart: unless-stopped
    ports:
      - 8080:8080
    volumes:
      - /var/run/docker.sock:/var/run/docker.sock:ro
    environment:
      DOZZLE_NO_ANALYTICS: "true"
      # Optional: Enable actions (Start/Stop/Restart) directly in the UI
      # DOZZLE_ENABLE_ACTIONS: "true"
      # Optional: Enable basic username/password authentication
      # DOZZLE_AUTH_PROVIDER: "simple"
Once running, navigate to http://<your-server-ip>:8080 to access the dashboard.
Although Dozzle has recently added basic container statistics (like CPU and memory indicators on the home screen), its primary strength lies in its raw log streaming. Beszel is much better suited for system and container resource monitoring since it stores historical data. Keep Dozzle for viewing, filtering, and debugging your container logs in real time.
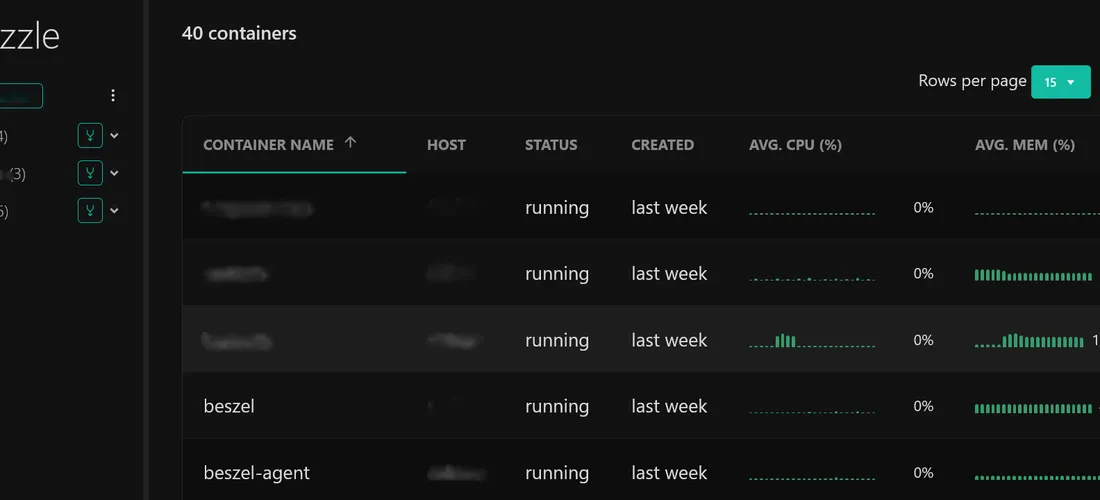
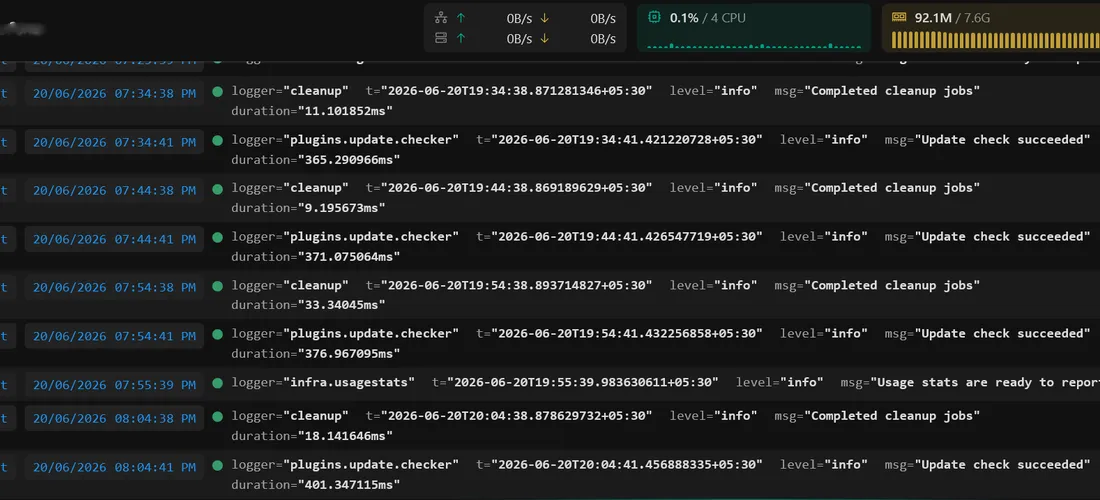
Selecting any container immediately opens a real-time, scrolling log output window, which makes troubleshooting and tracking down runtime exceptions simple.
3. Repurposing an old Android device as a node
One of the best ways to practice self-hosting sustainability is turning old Android phones into lightweight servers. You can run database backups, lightweight script runners, or DNS servers on them.
Because Beszel is compile-friendly, you can run the static arm64 binary of the agent directly on your Android device to monitor its CPU temperature, battery percentage, RAM, and network usage.
Setting up the agent via Termux
To install the agent on Android, you will use Termux, a terminal emulator and Linux environment app.
Step 1: Install Termux
Install the latest version of Termux from F-Droid or GitHub. Avoid the outdated version on the Google Play Store.
Step 2: Download the static ARM64 agent binary
Open Termux on the Android device and update packages. Download the latest compiled static arm64 Linux binary directly from the Beszel GitHub Releases page:
# Update package repositories
pkg update && pkg upgrade -y

# Download the static arm64 agent binary
curl -s -L -o beszel-agent https://github.com/henrygd/beszel/releases/latest/download/beszel-agent-android
# If you run into compatibility issues, you can download the standard static Linux arm64 binary:
# curl -s -L -o beszel-agent https://github.com/henrygd/beszel/releases/latest/download/beszel-agent_Linux_arm64.tar.gz

# Make it executable
chmod +x beszel-agent
Step 3: Run the agent
To start the agent and hook it up to your server’s central Hub, define the incoming port and the public key you generated inside the Hub dashboard:
PORT=4567 KEY="YOUR_HUB_PUBLIC_KEY" ./beszel-agentRoot vs. Non-Root: Running as a standard user in Termux works for general CPU and memory stats. However, if your Android device is rooted and you want full disk and battery metrics, run the binary as superuser by prefixing the command with
su(using Magisk/KernelSU).
To keep the agent running in the background on Android, you can use tmux, nohup, or write a simple Termux service script using Termux-services.
4. Testing and verification
Once you have set up the containers and Android agent:
- Navigate to your central Beszel Hub at
http://<server-ip>:9002. - Your primary server (where the agent runs with
network_mode: host) should already show metrics. - Add a new system for the Android device. Input the phone’s IP address and port
4567. - Within a few seconds, the phone’s stats, including CPU spikes and memory consumption, will populate in the dashboard.
FAQs
Can Beszel monitor containers on remote nodes?
Yes. The central Beszel Hub queries agents over the network. You simply install a beszel-agent container on any remote node, expose its agent port (default 4567), and add its IP address to the Hub.
How secure is Dozzle’s access to the Docker socket?
Mounting /var/run/docker.sock grants root-level privileges to the host. To secure Dozzle, mount it as read-only (:ro) as shown in our compose configuration. If exposing Dozzle outside your home network, always run it behind a reverse proxy with TLS and enable authentication using DOZZLE_AUTH_PROVIDER=simple.
Does Beszel Agent work on non-rooted Android?
Yes, it executes and reports memory and CPU utilization on standard non-rooted Android devices. However, accessing detailed battery metrics or specific system storage paths may require root permission (su).
Can Beszel Agent monitor GPU temperatures?
Yes. By adding capabilities (SYS_ADMIN and SYS_RAWIO) and mounting GPU devices (e.g., /dev/dri), the agent can monitor Intel, AMD, or Nvidia GPU resource utilization and temperatures.